Chart Patterns Cheat Sheet: Every Trading Pattern Explained

A chart patterns cheat sheet is a quick-reference guide to the recurring shapes price makes on a chart — like head and shoulders, triangles and flags — and what each one tends to signal next. Chartists have named 50-plus formations, yet almost all sort into three families: reversal patterns that hint a trend is turning, continuation patterns that suggest it will resume, and bilateral patterns that can break either way.
This page is the hub. Below you’ll find a scannable reference to every major pattern, what each one means in one or two lines, and a repeatable method for trading any of them — entry, stop, and target. For the deep dives, we link out to full guides on the cup and handle pattern and on trading with supply and demand zones.
One honest note up front: chart patterns are probabilities, not promises. They describe crowd behavior that often repeats — they do not predict the future. Even the best-documented patterns fail a meaningful share of the time. Treat this cheat sheet as a way to read the odds, not a set of guarantees.
What chart patterns actually are
A chart pattern is a shape that price traces out over time as buyers and sellers fight for control. Because market participants tend to react to the same fear and greed in similar situations, certain shapes recur — and each recurring shape carries a rough tendency for what happens after it completes. The vocabulary is nearly a century old: Richard Schabacker mapped many of these shapes in his 1932 book Technical Analysis and Stock Market Profits, and traders have refined them ever since.
Patterns are a core tool of technical analysis, the study of price and volume rather than a company’s fundamentals. They differ from candlestick patterns, which form over just 1 to 3 candles and read short-term sentiment; the shapes on this cheat sheet are the larger structures — typically 20 to 200 candles from first pivot to breakout.
Two ingredients turn a shape into a usable signal:
- Volume. A pattern is far more trustworthy when volume behaves as expected — for example, drying up as a triangle narrows, then surging to 1.5–2× its recent average on the breakout. A breakout on weak volume is easy to fake.
- Confirmation. A pattern isn’t “triggered” until price actually breaks its key level (the neckline, trendline, or boundary) and, ideally, closes beyond it. Anticipating the break is how traders get trapped.
The three families of chart patterns
Almost every named pattern belongs to one of three families. Learn the families first and the individual shapes make far more sense.
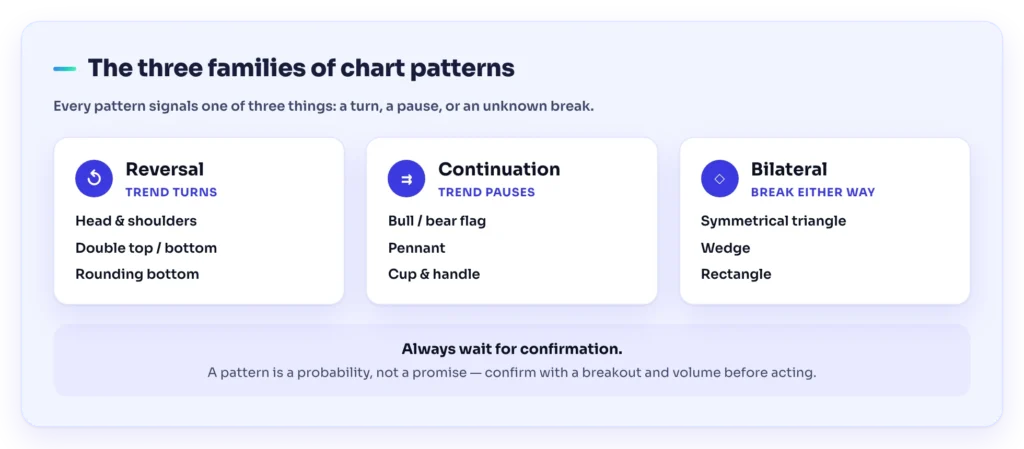
- Reversal patterns form at the end of a trend and warn it may be turning. A reversal at the top is bearish; a reversal at the bottom is bullish. Examples: head and shoulders, double top and bottom.
- Continuation patterns form during a trend, as a pause or consolidation, and suggest the existing trend will resume in the same direction. Examples: flags, pennants, rectangles, the cup and handle.
- Bilateral patterns are ambiguous by nature — they can break up or down, so you trade the direction of the actual breakout rather than assuming. Examples: symmetrical triangles and (depending on context) wedges.
The direction a pattern implies also makes it bullish (points higher) or bearish (points lower). A double bottom is a bullish reversal; a bear flag is a bearish continuation. Family plus direction is most of what you need to read the cheat sheet below.
The chart patterns cheat sheet
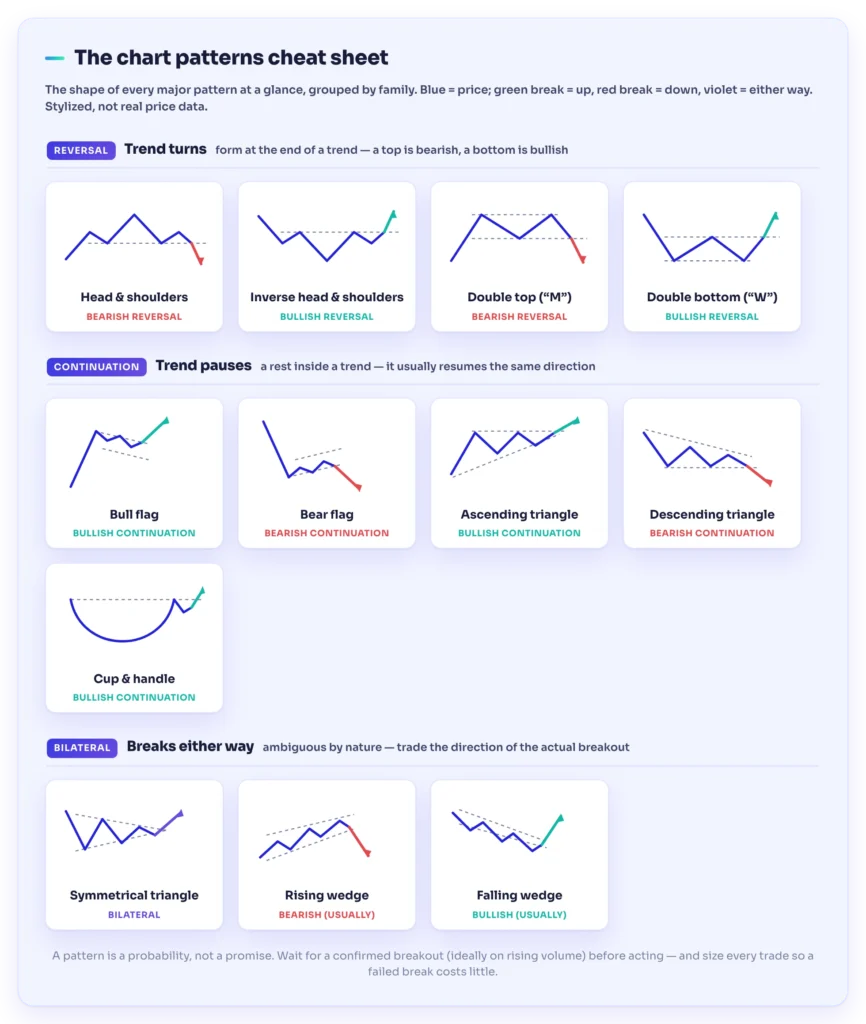
Here is the fast reference — grouped by family, with the one-line meaning of each. Full shapes and worked setups live in the deep-dive guides linked throughout. The hit rate column gives the rough historical odds of a confirmed setup reaching its measured-move target — directional orders of magnitude compiled in works like Bulkowski’s Encyclopedia of Chart Patterns, not guarantees.
Reversal patterns
| Pattern | Direction | Hit rate | What it signals |
|---|---|---|---|
| Head and shoulders | Bearish reversal | ~55% | Three peaks, the middle highest; breaks below the “neckline” to signal a top |
| Inverse head and shoulders | Bullish reversal | ~63% | The same shape flipped — three troughs marking a bottom |
| Double top (“M”) | Bearish reversal | ~65% | Two failed pushes at the same high; a top forming |
| Double bottom (“W”) | Bullish reversal | ~66% | Two successful defenses of the same low; a bottom forming |
| Triple top / bottom | Reversal | ~60% | Three touches of a level that finally gives way |
| Rounding bottom (saucer) | Bullish reversal | ~57% | A slow, curved base as selling exhausts and buyers return |
Head and shoulders is the best-known reversal: a peak (left shoulder), a higher peak (head), and a lower peak (right shoulder), all sitting on a support line called the neckline. The signal fires when price closes below the neckline.
Double tops and bottoms are the simplest reversals to spot — price tests a level twice and fails (top) or holds twice and bounces (bottom), forming an “M” or “W”. In Bulkowski’s samples the inverse head and shoulders and double bottom rank among the more dependable reversals (roughly 60–66% reaching target), while a single failed retest flips the read entirely.
Continuation patterns
| Pattern | Direction | Hit rate | What it signals |
|---|---|---|---|
| Bull flag | Bullish continuation | ~64% | A sharp rally, then a slight downward drift, before the trend resumes up |
| Bear flag | Bearish continuation | ~60% | A sharp drop, then a slight upward drift, before the trend resumes down |
| Pennant | Continuation | ~55% | Like a flag but the pause forms a tiny symmetrical triangle |
| Rectangle | Continuation | ~68% | Price ranges sideways between clear support and resistance, then breaks the way it came in |
| Cup and handle | Bullish continuation | ~61% | A rounded “cup” base and a small pullback “handle” before a breakout up |
| Ascending triangle | Bullish continuation* | ~63% | Flat resistance on top, rising lows underneath — buyers pressing in |
| Descending triangle | Bearish continuation* | ~60% | Flat support on the bottom, falling highs above — sellers pressing down |
Flags and pennants are short pauses after a strong move — the “flagpole.” The pause slopes gently against the trend (flag) or coils into a small triangle (pennant), then the trend continues. The cup and handle is a longer bullish base; because it’s a favorite of breakout traders, we cover it in its own cup and handle guide. Rectangles and bull flags top this group historically — in the 64–68% range on a clean, high-volume breakout — but a flag that drifts more than 3 weeks is usually a reversal in disguise.
*Ascending and descending triangles usually continue the prevailing trend but are classified by some traders as directional patterns in their own right — treat the breakout as the trigger either way.
Bilateral patterns
| Pattern | Direction | Hit rate | What it signals |
|---|---|---|---|
| Symmetrical triangle | Bilateral | ~54% | Converging highs and lows; coils tighter until it breaks either way |
| Rising wedge | Bearish (usually) | ~58% | Both boundaries slope up but converge; often resolves down |
| Falling wedge | Bullish (usually) | ~62% | Both boundaries slope down but converge; often resolves up |
| Broadening formation | Bilateral | ~52% | Widening highs and lows — rising volatility and indecision |
Symmetrical triangles show a market in balance: lower highs and higher lows squeezing into a point. They resolve when one side finally wins, so you wait for the breakout. Wedges tilt the odds — a rising wedge tends to break down and a falling wedge tends to break up — but, like all patterns, they still need confirmation. Symmetrical triangles resolve with the prior trend only ~54% of the time — barely better than a coin flip — which is exactly why you trade the breakout, not the coil.
How to trade any chart pattern
The value of a cheat sheet is that one method works across almost all of these shapes. Every pattern gives you the same four decisions.
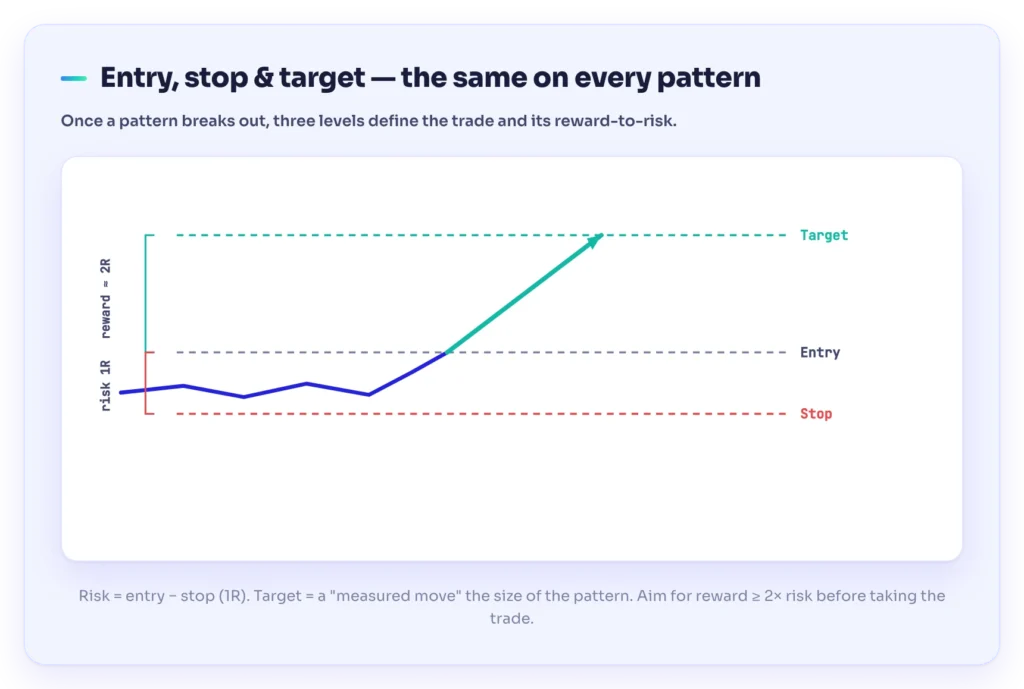
- Entry — trade the breakout, not the shape. Wait for price to close beyond the pattern’s key level (neckline, trendline, or range boundary), ideally on rising volume. Entering before the break is guessing.
- Stop-loss — just past invalidation. Place your stop on the other side of the level the breakout just cleared — for a bullish breakout, below the breakout point or the last swing low. If price falls back inside the pattern, the setup failed and you’re out small.
- Target — the measured move. Most patterns project a target equal to 100% of their own height. Measure the pattern from its highest to lowest point, then project that distance from the breakout in the breakout’s direction. A rectangle 8 points tall that breaks up projects roughly 8 points higher.
- Position size — risk a fixed, small fraction. Size the trade so the distance from entry to stop costs only 1–2% of your account. This — not the pattern — is what keeps one failed break from mattering.
Worked example. A stock rallies, then drifts sideways for two weeks between $50 support and $54 resistance — a rectangle. Volume fades during the range. Price then closes at $54.60 on a volume spike: that’s your entry. You put a stop just under the range at about $53.40 (roughly $1.20 of risk). The range is $4 tall, so the measured-move target is about $54 + $4 = $58. Risking ~$1.20 to make ~$4 is a favorable payoff — roughly 3-to-1 reward-to-risk — and if price slips back below $54 instead, you exit for a small, planned loss.
Do chart patterns actually work? The honest evidence
The research is genuinely mixed, and good traders know it. The landmark academic study — Lo, Mamaysky and Wang’s Foundations of Technical Analysis (2000), published in The Journal of Finance — ran a kernel-regression algorithm over 31 years of U.S. stock data (1962–1996), testing 10 pattern types. It concluded several do carry some incremental information, while classic shapes like the head and shoulders were not among the most informative. The practitioner tradition runs deeper still: Robert Edwards and John Magee first codified these formations in Technical Analysis of Stock Trends (1948), and Thomas Bulkowski’s Encyclopedia of Chart Patterns later catalogued more than 50 shapes across tens of thousands of hand-checked trades — reporting that even a strong setup like the head-and-shoulders top reaches its target only about 55% of the time, posts an average decline near 22% when it does work, and still fails outright roughly 4% of the time.
Common mistakes to avoid
- Trading the shape before it breaks. A pattern isn’t a signal until price confirms it. Anticipating breakouts is a top way beginners get trapped.
- Ignoring volume. A breakout on weak volume is the easiest kind to fail. Expect volume to expand on the real move.
- Seeing patterns that aren’t there. With enough imagination every chart has a “head and shoulders.” If you have to squint, it isn’t clean.
- Skipping the higher timeframe. A pattern on the daily chart carries far more weight than the same shape on the 5-minute or 1-minute. Check the trend it sits inside.
- No stop, or a moving stop. The measured move only pays off if you survive the failures. Decide your stop before you enter and leave it.
- Forgetting the psychology. Patterns are crowd behavior; so are your own hesitation and revenge trades. Our notes on trading psychology pair naturally with pattern work.
Where to go next
Bookmark this hub as your map, then go deep where it matters most. Two setups reward a full study: the cup and handle pattern, a classic bullish continuation, and reading supply and demand zones, which explains why the levels that patterns break tend to matter in the first place.
Frequently asked questions
What is a chart patterns cheat sheet? It’s a quick-reference guide to the recurring shapes price forms on a chart and what each one tends to signal. Patterns are grouped into three families — reversal, continuation, and bilateral — so you can identify a shape and its likely direction at a glance.
What are the three types of chart patterns? Reversal patterns (a trend may be turning), continuation patterns (a trend is likely to resume after a pause), and bilateral patterns (which can break either way, so you trade the actual breakout). Every named pattern fits one of these families.
What is the most reliable chart pattern? There’s no universally “most reliable” pattern — reliability depends on the timeframe, the trend it sits in, volume confirmation, and risk control. Well-watched patterns like head and shoulders, double tops/bottoms, and the cup and handle are popular precisely because many traders act on them, but all of them fail a meaningful share of the time.
Are chart patterns the same as candlestick patterns? No. Candlestick patterns form over one to three candles and read short-term sentiment. Chart patterns are larger structures built over many candles, describing the bigger battle between buyers and sellers.
How do you trade a chart pattern? Wait for price to close beyond the pattern’s key level (the breakout), ideally on rising volume. Enter on the confirmed break, place a stop just past the level in case it fails, and set a target using the measured move — the pattern’s own height projected in the breakout’s direction.
Do chart patterns really work? The evidence is mixed. Academic and practitioner studies find patterns carry some modest edge when paired with volume confirmation and disciplined risk management, but little edge on their own. They shift the odds; they don’t guarantee outcomes.
Sources
- Lo, A. W., Mamaysky, H., & Wang, J. (2000). Foundations of Technical Analysis: Computational Algorithms, Statistical Inference, and Empirical Implementation. The Journal of Finance, 55(4), 1705–1765 — found several technical patterns carry some incremental information, while head-and-shoulders was not among the most informative. doi.org
- Bulkowski, T. N. Encyclopedia of Chart Patterns (Wiley Trading) — practitioner performance statistics showing even strong patterns (e.g. the head-and-shoulders top) meet their price target only about half the time. thepatternsite.com
Risk warning. Trading and CFDs carry a high level of risk and may not be suitable for all investors. Chart patterns are educational tools, not trading signals, and do not guarantee results — patterns fail a meaningful share of the time. This article is for educational purposes only and does not constitute financial advice.